Book a discovery call

Book a discovery call
We build decision-grade dashboards that connect your data, systems, workflows, and finances into a single live picture of organizational health. It refreshes itself overnight, flags what needs your attention, and it's ready before your coffee is.


.svg)
Enrollment
Project Tools
If you run an organization, you know the Monday ritual. The numbers you need live in six systems and four inboxes. Someone spends half a day assembling a report that's stale by Wednesday. And the question that actually matters, where do I need to lean in this week, goes unanswered while everyone hunts for exports.
Your finance system knows what happened. Your CRM knows what might happen. Neither shows you how one moves the other.
Leaders have been asking for one clear view for years. The tools were too expensive, too rigid, or too dependent on a full-time analyst to keep alive. That's the part that just changed.
Every dashboard we build is custom to the organization it serves. Three properties hold across all of them:
We wire into the systems you already run: your finance stack, CRM, donor platform, point of sale, enrollment data, project tools. Money, people, programs, and pipeline in one view, every source.
Data refreshes nightly, lights out. We own the pipeline, the monitoring, and the fixes, so the picture is current every morning with no effort from your team.
AI does the assembling, the scoring, and the flagging. Your dashboard opens with the one thing that needs you today, connects signals across departments, and speaks plain language.
Your car shows speed, fuel, temperature, and the warning lights in one glance, because driving takes the full picture at once. Leading does too. Ours connect your finances to everything else, so you see how every part of the machine is running and how each part moves the others: what a dip in giving does to program capacity, what a hire does to runway, what this quarter's pipeline means for next quarter's budget.
And the best views include levers. Adjust an assumption, a price, a headcount, a program investment, and watch the projected effect move across the picture before you commit.
These are active builds for real organizations, shown as working prototypes with sample data. Click in, move around, and picture your organization's version.
If you sit over multiple people, programs, or departments, this was built for you.
Program outcomes, grants pipeline, fundraising, financial health, and funder-ready reporting in one place.
Revenue, cash, operations, marketing, and pipeline connected, from the boardroom view to the daily pulse.
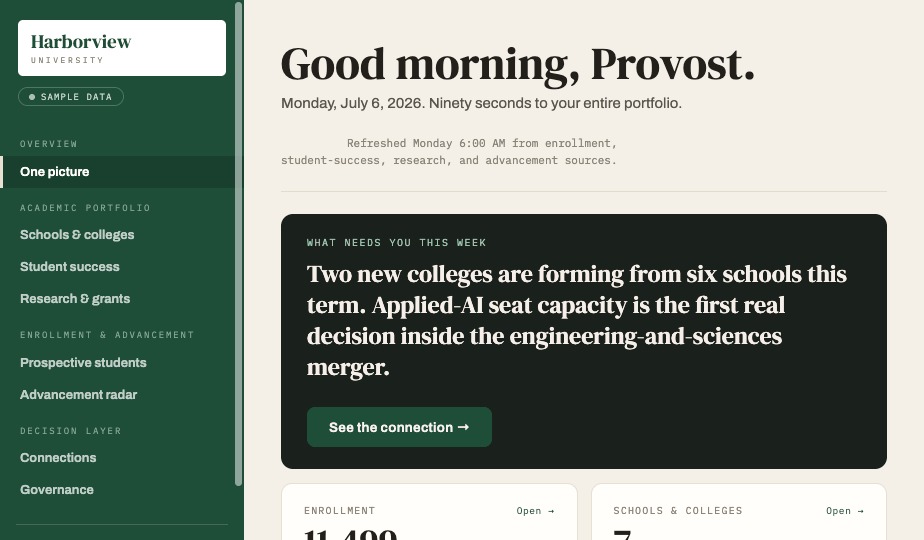
Enrollment, advancement, budget, program health, and the initiatives in motion, on one screen the cabinet can share.
Multi-partner efforts where the data lives in many hands and the accountability lives in one.
Dashboards are one of the most tangible outcomes of our AI Readiness Roadmap. Some organizations start with the Roadmap and arrive here. Others start here and grow into the bigger picture. Both doors work.
One conversation. We learn how you lead, what you check, and where the picture breaks down.
A clickable version of your dashboard, in your brand, within days. You react to something real instead of a spec.
A few working conversations and system access. We inventory where your data lives and design the connections, so you see exactly what feeds what.
We wire the live data, set the refresh cadence, and harden the pipeline.
We operate it for you: monitoring, fixes, and improvements on a monthly plan sized to your needs.